What price leaves behind

Price is often misunderstood because the real market imbalance behind every move remains invisible to most traders. Most traders see movement, candles, and patterns – but very few understand what actually creates that movement in the first place.
Price is random. It is a reaction to imbalance.
If you’d like to explore these concepts in greater depth, you’ll find them explained step by step in my book.
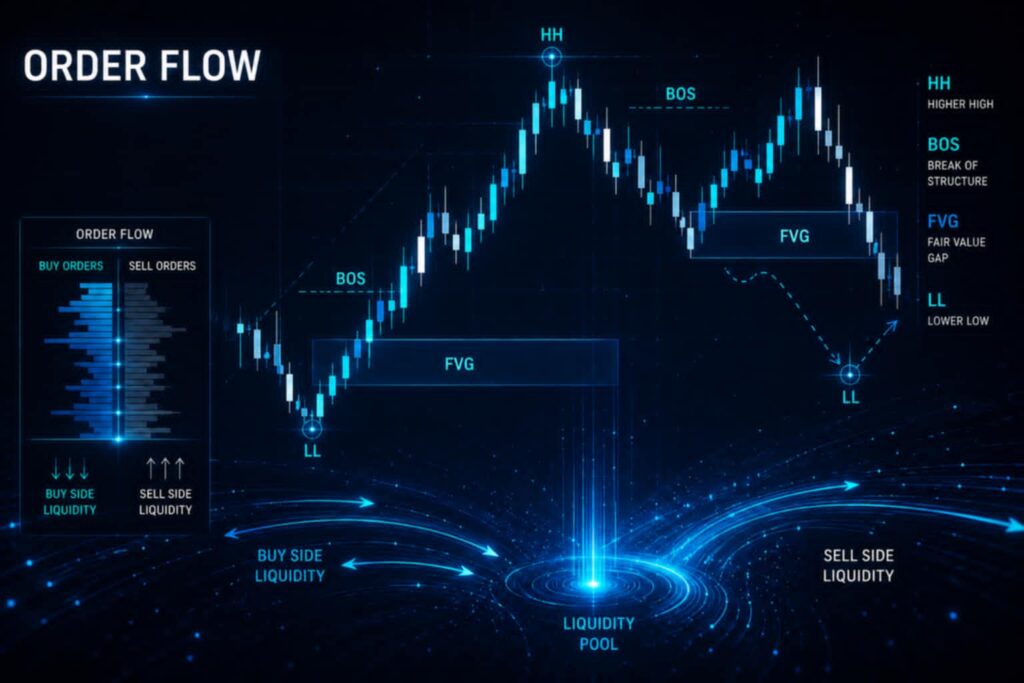
Every single candle on a chart represents a battle between buyers and sellers, but more importantly, it represents where liquidity was taken and where it still remains.
This is where the market imbalance behind price movement becomes visible.
Liquidity is the real engine behind price movement. Without liquidity, price cannot move. It can only stall.
When you start looking at the market through this lens, everything changes. You stop focusing on indicators. You stop chasing signals. And you start observing structure.
Because structure is where the truth is hidden.
Market footprints
Every move behind the market leaves behind something. These “footprints” are not visible to the untrained eye, but they are always there.
A sudden spike upward is not just bullish strength. It is often the result of liquidity being taken from one side of the market.
A sharp drop is not just panic. It is a reaction to imbalance being corrected.
Price is constantly searching. Searching for liquidity. Searching for inefficiency. Searching for areas where orders are stacked.
And once it finds them – it reacts.
Most traders see the reaction. Very few understand the reason behind it.
Liquidity is the truth
If you understand liquidity, you understand everything.
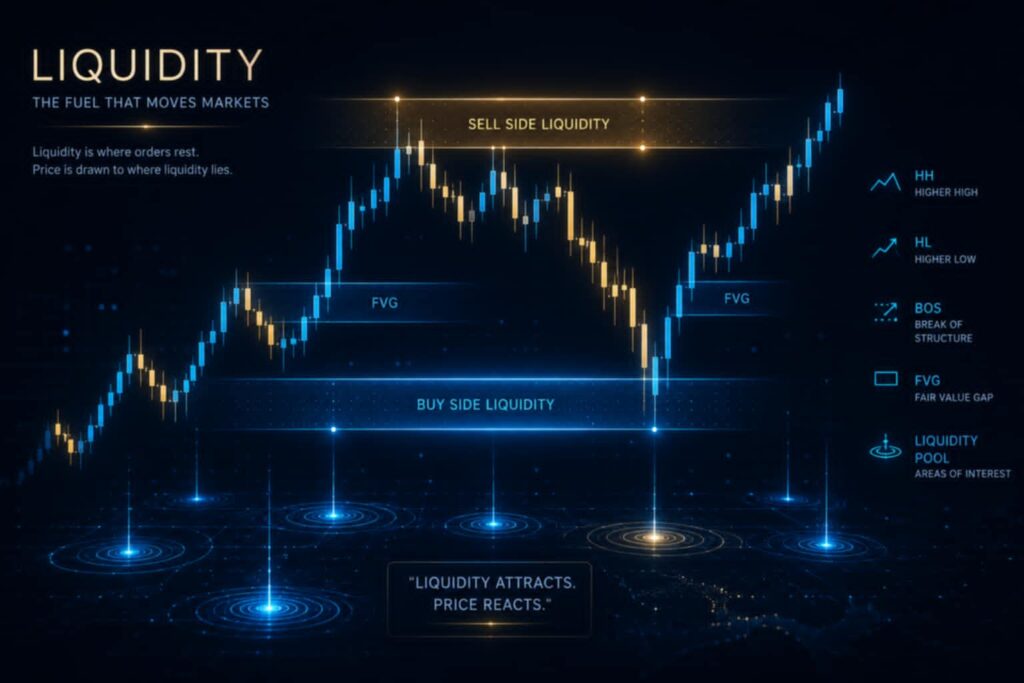
Liquidity is where orders exist. It is where stops are placed. It is where the market knows it can move efficiently.
Price does not move because of “news” or “emotions”. It moves because it needs fuel – and that fuel is liquidity.
This is why the market often moves in ways that feel “designed”.
It is not designed. It is structured.
The market is simply doing what it has always done: moving toward areas where it can execute large orders efficiently.
The illusion of directions
One of the biggest mistakes traders make is believing in direction too early.
They see a candle and assume:
-
- “It’s going up”
-
- or “it’s going down.
But price does not move in straight lines. It moves in expansion and retracement cycles.
What looks like a trend is often just liquidity being taken in stages.
The market rarely moves in a clean direction without first misleading participants.
This is why so many traders get caught in emotional decisions. They react to what they see, not what is actually happening.
What price actually leaves behind
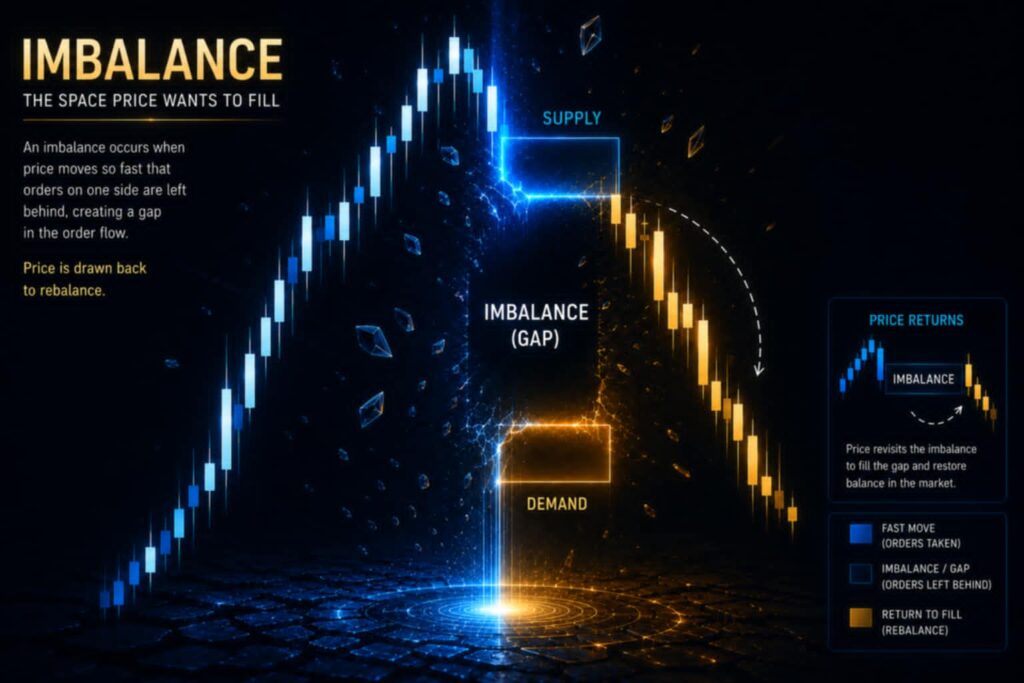
When price moves, it does not disappear. It leaves structure.
That structure includes:
-
- highs and lows
-
- inefficiencies
-
- unfilled orders
-
- liquidity pools
These are the areas price often returns to.
Not because it “wants” to – but because the market is always seeking balance.
Think of price as a process, not an event. Every move creates an imbalance. Every imbalance creates a future reaction.
This is the cycle.
Understanding the Real Market Imbalance
Once you stop thinking of the market as prediction, and start seeing it as reaction, your entire perspective changes.
You no longer ask:
-
- “Where will price go?”
Instead, you start asking:
-
- “Where is liquidity?”
-
- “What has price left behind?”
-
- “What imbalance is waiting to be filled?”
This shift removes emotion from trading.
Once you understand market imbalance, you no longer react to every move – you understand why it happened.
And without emotion, decisions become clearer.
Final thought
Price is not telling you where it is going.
It is showing you where it has already been.
And what it leaves behind is always more important than the move itself.
Because in those footprints – the real story of the market is written.

If you enjoyed this article and want daily market insights, observations, and educational content, follow me on Instagram.